CategoryUncategorized

The Decolonial Atlas

We would like to introduce a collective which currently is and has been since 2014 showing a wide variety of mapping productions on many different topics and regions. Within these different productions many of the basic premises of critical cartography can be recognized.

“The Decolonial Atlas, started in 2014, is an attempt to bring together maps which, in some way, challenge our relationships with the land, people, and state. It is based on the premise that there is no such thing as “truth” in cartography. Only interpretation. The orientation of a map, its projection, the presence of political borders, which features are included or excluded, and the language used to label a map are all subject to the map-maker’s agenda. Because most maps in use today serve to reinforce colonial understandings of the Earth, we are consciously creating maps which help us to re-imagine the world – to decolonize.”

https://decolonialatlas.wordpress.com

Enjoy!

Critical Atlas Workshop

Lento pero Avanzo 😉

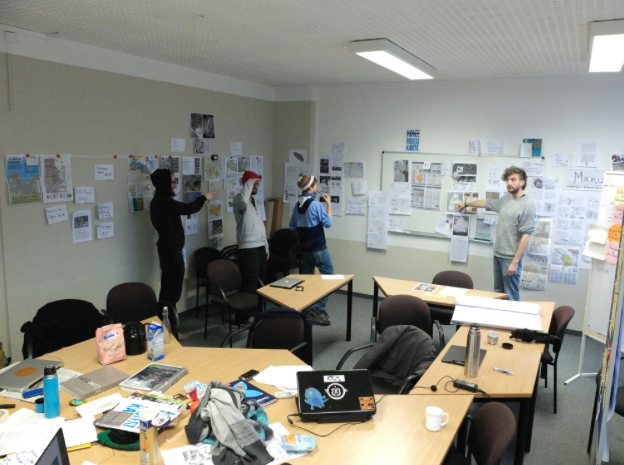
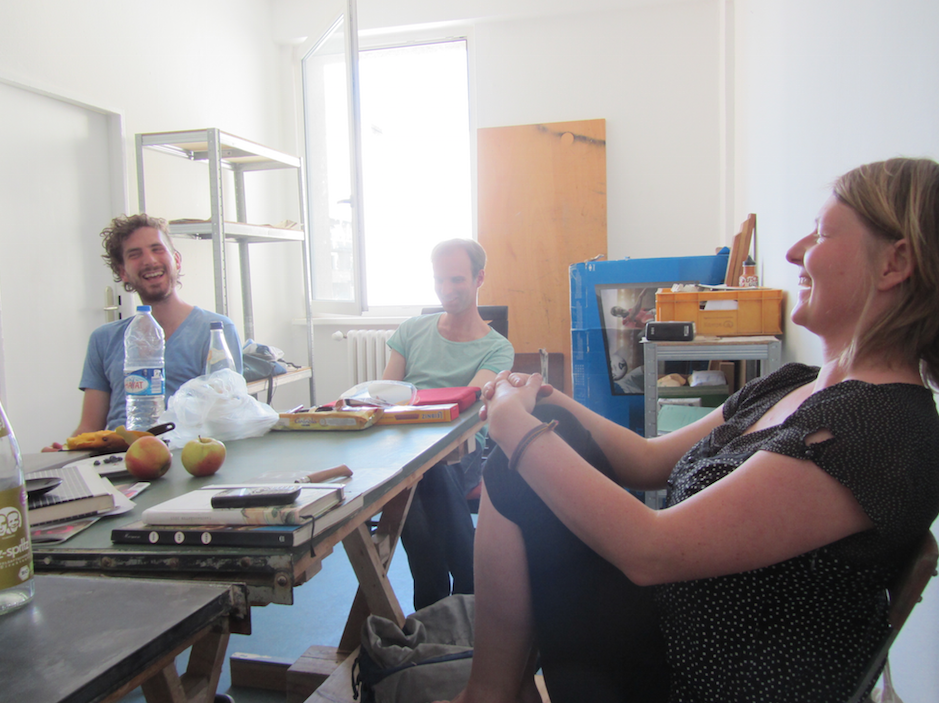
This year we had already two editors workshop  of the Critical Atlas. Apart from people working on the Atlas for 1.5 years we welcomed some new people who want to contribute to the project. Besides from organizing stuff in and around the project, we tried to find a structure for the Atlas. Thanks to the overwhelming feedback from all over the world it won’t be easy to bring things together. We are working on it and will keep you updated.

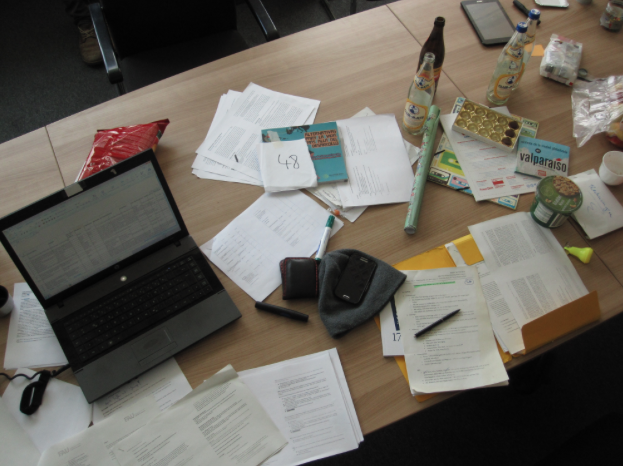
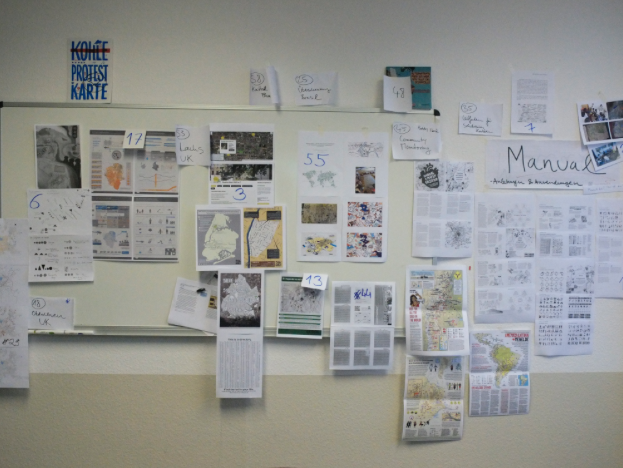
Attached you’ll see some photos of our organized mess. Thanks for sticking with us.
Bildschirmfoto 2016-05-02 um 18.25.26Bildschirmfoto 2016-05-02 um 18.26.03Bildschirmfoto 2016-05-02 um 18.25.41Bildschirmfoto 2016-05-02 um 18.29.41Bildschirmfoto 2016-05-02 um 18.26.10


Those who go slow go far…

lento-pero-avanzo


Hopefullly our slow pace approach will guide us on our rocky road to the publication of the critical atlas in 2017.

“Cartography Is Dead (Thank God!) Let’s admit it. Cartography is dead. And then let’s thank our lucky stars that after the better part of a century mapmaking is freeing itself from the dead hand of academia.”

Taken from a nice article by Denis Wood (2003). Worth reading. http://makingmaps.owu.edu/mm/cartographydead.pdf

Strait of Gibraltar

This map titled “Una cartografía del territorio geopolítico del Estrecho de Gibraltar” (A Cartography on the Geopolotical Area of the Strait of Gibraltar) tells on two pages the the story of space in and around the Strait of Gibraltar.

The map was designed by artists, activists and technologists from Spain and Morocco in the aftermath of the Fadiat 2004. On the one hand the map shows the area as a space of sociopolitical conflict. On the other hand, the map understands the area as a place of transformation. The three main topics shown in the map are migration and borders, new forms of work/precarious work and free communication/free knowledge. One page one the map depicts the area as a place, coined through militarization, migration, relocation of the capital, communication and social movements. On page two the map shows active social movements on both sides of the border as well as their active projects.

The map was created through an open Wiki where everyone was able to suggest content. The content was then discussed and finally put to paper. The map is used in social movements and is used as a basis for discussions.

Space, Refugees and Berlin

How do Refugees move around Berlin? How do they organize to get through and where do they take space? What images do they create from themselves?

These questions were answered by the artists Sarnath Banerjee, Christian Hanussek and Diana Lucas-Droganas in cooperation with many others. The results are different scripts/handwritings which are in the broadest sense cartographic translation of their reality onto paper. In a Triology they tell us about the different dimensions of what we call “Refugee Comlpex”.

“The image series in the system revolves around deprivation of rights, dailylife tactics, survival strategies, and forms of resistance; the collective mapping sur place reconstructs urban seizing of space and everyday self-organisation in circumstances of exception; the multilayered notation Resumption Rehearsal retakes the issue of a self-organised centre of refuges in the city.”

On the 21. November participants will presents and explain three “mappings” in the foyer of the Gorki Theatre (12 – 15h). A round table (15-17h) with additional guests will take place to discuss the problems of mapping and cooperation as well as the questions which new spaces might emerge from this prosses.

For further information see metroZones, and Gorki theatre.

Geoweb

Mit dem öffnen von GIS für “nicht-professionelle Kartographen*innen” durch Angebote wie Google Maps, Flickr, Openstreetmap Twitter und andere wurde ein wechsel in der Erzeugung von geographischen Wissen beschrieben. So bietet Twitter beispielsweise die Möglichkeit tweets zu geokodieren. Auf Flickr kann man seine Fotos auf eine Weltkarte verorten und bei Openstreetmap kann jeder zur Kartierung der Welt beitragen. Nicht mehr “hochspezialisierte Kartographen*innen” erzeugen jetzt geographisch Inhalt, sondern rein theoretisch jede*r der*die ein Handy, Computer und/oder ein GPS fähiges Gerät besitzt kann jetzt Daten erzeugen, welche im euklidischen Raum lokalisiert sind – und Millionen nutzen diese Möglichkeit.

Die so entstandene Praxis wurde “VGI – Volunteered Geographic Information”, “Geoweb”, “Virtual Geographic Environment” oder “Neogeography” genannt. Diese scheinbare Öffnung von GIS durch frei nutzbare Angebote und niedrige Hürden hat einige Wissenschaftler*innen dazu veranlasst, GIS nun als demokratisiert zu bezeichnen. Forscher wie Graham, M., Hale S. A., Stephens, M. (2011), Zook, M., Graham, M., Shelton, T. (2011), Zook, M., Graham M. (2011), Wall, M., Kirdnark, T. (2012), Haklay (2012, 2013), Crampton J. W., Graham, M., Poorthuis, A., Shelton, T., Stephens, M., Wilson M. W., Zook, M. (2013) arbeiten, um diese Annahme zu widerlegen. Sie zeigen das es lediglich eine bestimmte Gruppe von Nutzer*innen ist, die geographische Inhalte erzeugen und wiederlegen so die Annahme der demokratisierung von GIS.

Eine Studie von Christian Bittner (2015) geht noch weiter. Sie zeigt Unterschiede in den Communities von Openstreemap und WikiMapia. Genaugenommen wird am Beispiel Jerusalems herausgearbeitet wie auf  Openstreetmap und WikiMapia, verschiedene Flächen  in der Stadt unterschiedliche kartiert sind. Das Ergebnis: Auf Openstreetmap sind die israelisch-säkular geprägten Viertel besser kartiert als die ultraorthodox-israelischen und arabischen Viertel. Bei WikiMapia sieht das Ergebnis anders aus. Hier ist die Datenlage zu den arabisch-palästinensischen Vierteln Jersualems besser als zu den jüdisch-israelischen Vierteln. Der Autor schließt daraus auf die unterschiedliche Zusammensetzung der beiden online Communities.

Diese Studie zeigt das im Geoweb und in der Praxis der Neogeography nicht von einem Projekt auf das nächste, und auch nicht von einer Community auf die nächste geschlossen werden darf. Es gilt vielmehr genau hin zu sehen und die verschiedenen Nutzer*innengruppen zu untersuchen.
Reclaim your city

Reclaim Your City – Stadtaneignung und Protestkommunikation

Stadtkarten sind ein praktisches Werkzeug, nicht nur wenn man die richtige Straße sucht, denn sie können auch Besetzungsgeschichte festhalten, Gentrifizierung analysieren, städtische Gemeingüter visualisieren oder helfen urbane Bewegungen zu organisieren. Seit einigen Jahrzehnten werden Karten immer mehr dazu benutzt um den staatlich oder kommerziell geprägten Stadtbildern eine Sicht „von unten“ entgegenzusetzen. Eine kritische Sicht auf Karten zerpflückt die dominante Erzählweise von vermeintlich neutralen Stadtplänen. Aktivistische, künstlerische und partizipative Kartierungen stellen  die herrschende Wahrnehmung von urbanen Räumen sowie deren Planung nicht nur in Frage sondern schenken alternativen Visionen und Gestaltungen Raum.

Wir wollen verschiedene Berliner Kartenprojekte spielerisch vorstellen und freundschaftlich diskutieren um die Grenzen und Möglichkeiten der kritischen Kartographie als politische Intervention gemeinsam auszuloten. Wir werden dabei euer Weltbild auf den Kopf stellen, also bringt eure Lieblingskarte mit um euch daran festzuhalten.

Beim Reclaim your city kongress organisiert orangotango mit politischen Karten-Initiativen (u.a. Leerstandsmelder, Bizim-Kiez,
Commons Xberg Karte, transforMap und Berlin besetzt) einen Workshop zum “Kritischen Kartieren”.

Ort und Zeit: Sa. 26.9 um 17:00 im Theater

“The fact that groups across the political spectrum create these sorts of maps illustrates that counter-mapping itself is not necessarily politically progressive, but that geographical imaginations are important sites of struggle.” (Wood cited from Dalton & Mason-Desee 2012:443)

Dalton, C., Mason-Desee, L. 2012:  Counter (Mapping) Actions: Mapping as Militant Research -Counter Cartographies Collective. In: An International E-Journal for Critical Geographies 11(3), p. 439-466.

Wie würde der Kontinent Afrika aussehen…

… wenn Europa Afrika nicht Kolonialisiert hätte? Diese Frage stellt sich Nikolaj Cyon in seinem Projekt Alkebu-lan 1260 AH. Nikolaj spielt folgendes Gedankenspiel: Was wäre, wenn Europa um 1350 wesentlich härter von der Pest getroffen worden wäre,  sodass nicht 1/3 der Bevölkerung, sondern 2/3 gestorben wären. Und was wäre, wenn sich der europäische Kontinent davon nicht so schnell erholt hätte?

Nikolaj versucht weg von den durch Lineale gezogenen Grenzen, die noch heute den afrikanischen Kontinent durchziehen, zu kommen. Um seine alternative Karte zu erstellen, hat sich der Künstler linguistische Karten vom afrikanischen Kontinent angeschaut und Informationen zu den afrikanischen Sprachen von der UNESCO und Wikipedia zusammengetragen. So rekonstruiert er Flächen mit der selben Sprache, aus denen letztendlich die hypothetischen Staatsgebiete hervorgehen. Sicherlich nicht ohne Kritik, aber dennoch ein interessanter Ansatz, wie der afrikanische Kontinent ohne den Einfluss der europäischen Kolonialmächte aussehen könnte.

In seiner Präsentation erklärt er detailliert wie er zu der Karte gekommen ist und was ihn angetrieben hat.

© 2024 A Critical Atlas

Theme by Anders NorenUp ↑